Biotech Valuation Idiosyncrasies and Best Practices
Biotech companies with little to no revenue can still be worth billions. Consider the most prominent 2017 biotech M&A deal when Gilead bought Kite Pharma for almost $12 billion. At the time of the deal, Kite had over $600 million in accumulated deficit, but it also had a pipeline of CAR-T cell therapies, which treat cancer. This article examines how to value such pipelines. It also focuses on the risk-adjusted NPV valuation methodology, portfolios of multiple drug candidates, and how value is impacted by the characteristics of the investor or acquirer.

Biotech companies with little to no revenue can still be worth billions. Consider the most prominent 2017 biotech M&A deal when Gilead bought Kite Pharma for almost $12 billion. At the time of the deal, Kite had over $600 million in accumulated deficit, but it also had a pipeline of CAR-T cell therapies, which treat cancer. This article examines how to value such pipelines. It also focuses on the risk-adjusted NPV valuation methodology, portfolios of multiple drug candidates, and how value is impacted by the characteristics of the investor or acquirer.

Raphael is a partner at a crypto hedge fund. Prior, he founded and exited a fintech company, and worked as a banker and equities investor.
Expertise
PREVIOUSLY AT

Executive Summary
Why Biotech Pipeline Valuation Is Different
- Many biotech firms do not yet have revenues. Cash flows prior to approval of a drug will be significantly negative. That means "standard" valuation multiples like EV/EBITDA or P/E are less relevant. There are some alternative multiples like EV/invested R&D, which is essentially a cost-based valuation. The comparative valuation methodology is another popular methodology which utilizes public market comparables or comparable M&A transactions; it is often not applicable because most biotech companies are idiosyncratic. Even for more established biotech companies, their historical revenues are typically idiosyncratic enough that estimates still have to be built up from scratch
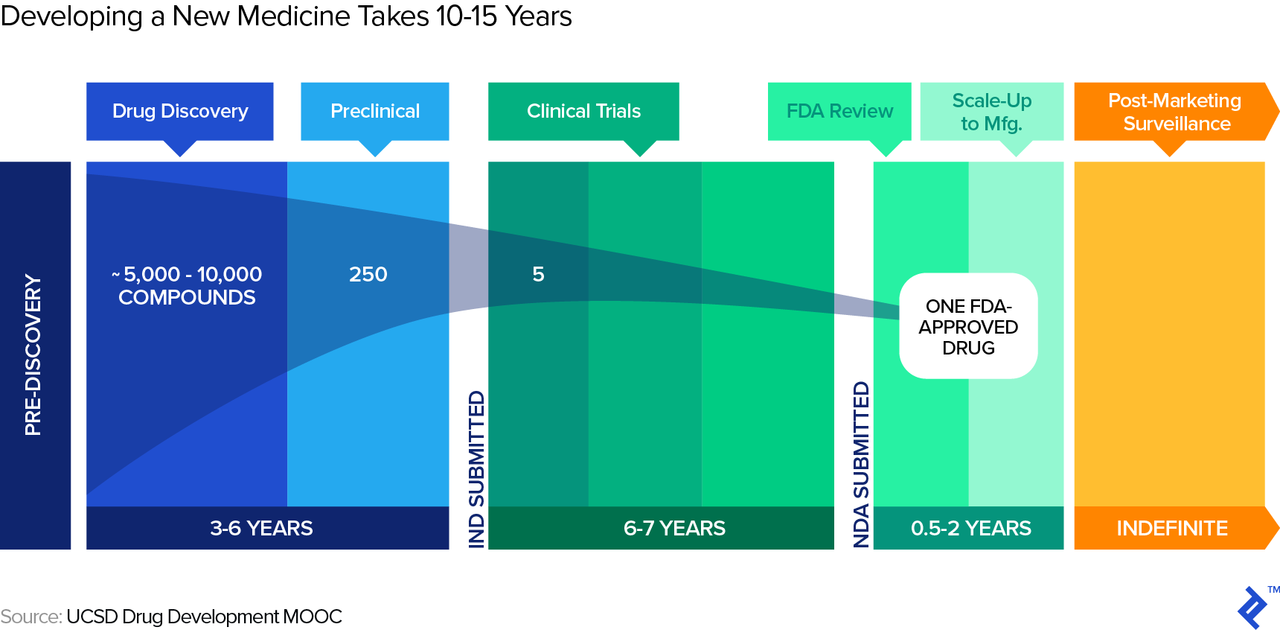
- Structured development process. A typical timeframe for a new drug from submission of the Investigational New Drug (IND in the US) to market entry, post regulatory approval, is around eight years. During those eight years, the process follows structured phases of research, testing, and FDA review, during any of which the drug can fail.
- A drug is either effective or not. Prior to approval, drugs go through a structured process (pre-clinical and clinical trials), at any point during which they can fail—and once they fail, the process is often irreversible. That represents a different risk profile from most other businesses, where the outcome distribution is less binary. Consequently, we need to reflect this different risk profile, such as when creating a discounted cash flow (DCF) and choosing the appropriate discount rate.
Recommended Valuation Methodology: Risk-adjusted NPV
- Development phase. In the initial years, there are only outflows, due to the R&D expenses on the drug. These costs will differ for each drug depending on factors such as the number of iterations during the discovery and pre-clinical phases, the experimental design(s) required during pre-clinical and clinical trials, and more.
- Revenue/market phase. When the drug has reached the market, key drivers we need to estimate in order to derive revenue (and profit) projections include the following: number of potential customers/patients, pricing, margins, and the ramping up and down of revenues.
- Other potential influencing factors. Potential adjustments to the typical revenue/cash flow curve include partnerships (such as a strategic partner who helps out with R&D and/or marketing expenses in exchange for revenue share) as well as accelerated regulatory review which both the FDA and the EMA offer for qualifying drug candidates (effectively compressing the cash flow curve).
How About Cures?
- What if the therapy candidate proposes to completely cure a condition rather than treat or manage it via repeat administration (what we implicitly assume above)? Especially with the advent of the first approved gene therapies, this is now an increasingly relevant possibility.
- The revenue curve may look different. This is because, in theory, the therapy should initially work its way through all (reachable) patients suffering from the condition, but then (assuming it can reach its entire existing patient universe during the time of patent protection) drop to new cases only (the "incidence" rate).
- Pricing and pricing structure become even more challenging. Does the drug company charge a one-time up-front fee (and, if so, is there a "clawback" if the patient relapses) or perhaps a multi-year installment payment plan, conditional on the patient not relapsing? And, is this latter option even feasible from a legal point of view in the jurisdiction of sale? As an aside, prices for these one-time cures become very high as, of course, they are supposed to essentially reflect the NPV of the savings on what could otherwise be continued care.
Probability of Scenarios
- To calculate the probability of success for a drug candidate, as a general principle, we should be "good Bayesians," starting with a sensible base rate of success and then continuously adjusting for new evidence.
- There are further potential adjustments to the base rate one could come up with, even such that do not have anything to do with the drug itself, such as the track record of the company (its R&D and regulatory teams) in getting drugs approved. There are also less trivial adjustments; for instance, imagine that a drug of a competitor, targeting perhaps the same pathway, runs into problems in a clinical trial.
Discounting Back to the Risk-adjusted NPV
- Once we have developed the scenarios and their respective cash flows and probabilities, we need to discount the cash flows back to the present.
- Baseline discount rates include the following: 12-28% for early stage, 10-22% for mid stage, and 9-20% for late stage.
- It is important to correctly interpret this risk-adjusted NPV: It's an expected value, masking an underlying outcome distribution that can be as simple as being close to binary (e.g., a company with one phase III drug in the pipeline) or much more complex in the case of a company with multiple drugs in its development pipeline.
Introduction
If you’re interested in or have experience in the biotech space, it should come as no surprise that biotech companies with little to no revenue can still be worth billions. Consider the most prominent 2017 biotech M&A deal when Gilead bought Kite Pharma for almost $12 billion. At the time of the deal, Kite was still loss-making, with over $600 million in accumulated deficit, but significantly, it also had a pipeline of CAR-T cell therapies, which treat cancer. Kite wasn’t necessarily an anomaly. Almost 80% of the constituent companies of the Nasdaq Biotech Index (NBI) companies have no earnings; over 150 companies representing over $250 billion in market capitalization. And, the average VC investment in biotech has more than doubled over the past decade, from $4.6 billion in 2005 to $12.9 billion in 2015. As institutional equity investors, it’s clear that this cannot be simply explained by the exuberance of investors. Rather, it’s meant to demonstrate that pipeline often justifies the value of a company.
This article examines how to value such pipelines of biopharma companies, focusing on pharma companies specifically (and not companies that do not focus on drug development but on other healthcare devices). We’ll start with how biotech companies’ valuations are different from the valuation of other assets. Then, we’ll focus on the risk-adjusted NPV valuation methodology, and close with a discussion of a couple relevant topics: (i) how one can think about portfolios of multiple drug candidates, and (ii) how value can be impacted by the characteristics of the investor or acquirer.
Why Do We Need to Understand Biotech Pipeline Valuation?
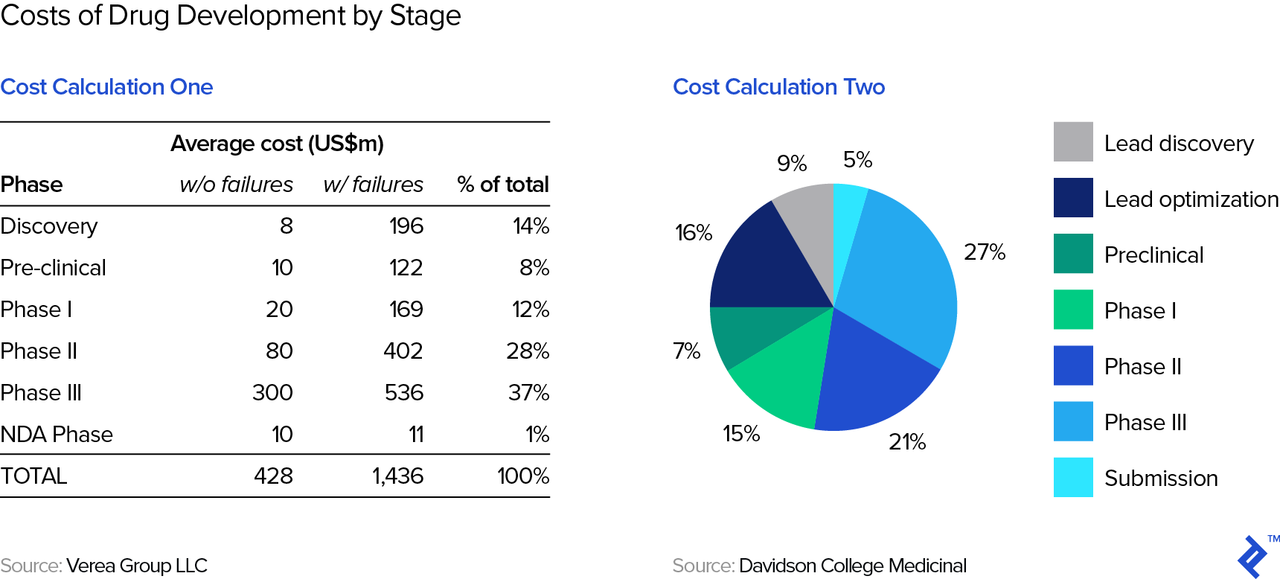
Drug development is expensive. One prominent study estimated that the total cost of developing a successful drug (which typically involves a lot of failed attempts) exceeds $2.5 billion. Other studies (see below table) show costs to total around $1.4 billion. This figure is lower than the $2.5 billion estimate above because the latter also includes an estimate of the opportunity cost of the capital invested, while the former represents out-of-pocket expenses only.
Therefore, drug development requires a lot of capital from the get-go. Simply put, it’s nearly impossible to bootstrap a drug company and thus require investors from the outset as well as at various points during the development cycle. These investors can include venture capitalists (people like e.g., Domain, HCV, MPM, and many others), strategic investors (i.e., other pharma companies), and also public market investors (which is why we end up with so many companies in the NBI). Fundraising for biotech is easily an article in itself, but both investors and founders/biotech executives will need to master valuation—even if an approved, a marketable product may be many years in the future.
On a timely note: If you are reading this from Asia, you are probably aware that the Hong Kong Stock Exchange recently allowed biotech firms to be listed without revenues or profits, the valuation of which will require what we will discuss in this article.
Why Biotech Pipeline Valuation Is Different
Biotech firms are not your standard widget manufacturer that you learned to value in your MBA and/or CFA courses. Read on to understand some of the unique traits specific to the industry.
What Revenues?
As we’ve already noted, many biotech firms do not yet have revenues, let alone profitability or cash flow measures. In fact, cash flows prior to approval of a drug will be significantly negative. That means “standard” valuation multiples like EV/EBITDA or P/E are less relevant. There are some alternative multiples like EV/invested R&D, which is essentially a cost-based valuation. The comparative valuation methodology is another popular methodology which utilizes public market comparables or comparable M&A transactions. It is often not applicable because most biotech companies are idiosyncratic, thus rendering comparative analysis of limited use. We will review an alternative valuation method below.
Even for more established biotech companies, their historical revenues are typically idiosyncratic enough that estimates still have to be built up from scratch rather than relying on past intra-company experience/data or even from other, comparable companies as guide rails for projections. In other words, the typical approach to projections of extrapolating past trends is pretty much out. For example, see below for the current pipeline of Swiss pharmaceutical research company Idorsia and note the range and variety of both mechanism of action (the process by which the drug produces a pharmacological effect) and target indications (the use of that drug for treating a certain disease).

Structured Development Process
Biotech companies also face a long period of development unique to the industry. A typical timeframe for a new drug from submission of the Investigational New Drug (IND in the US) to market entry, post regulatory approval, is around eight years, as illustrated in the graphic below. During those eight years, the process follows structured phases of research, testing, and FDA review, during any of which the drug can fail.
Drug Roulette: Red or Black?
Simplistically said, a drug, in the end, is effective or not at treatment. Even if it is effective, it may or may not get approved by the regulatory bodies. Prior to approval, drugs go through a structured process (pre-clinical and clinical trials), at any point during which they can fail—and once they fail, the process is often irreversible. That represents a different risk profile from most other businesses, where the outcome distribution is less binary. In Silicon Valley speak, it is typically very hard to “pivot” a failing drug. True, in early stage, non-biotech startups, failure is also a likely outcome, but if the startup does not fail, there is a fairly wide distribution of outcomes: That new mobile app may get thousands of downloads or tens of millions of downloads, with the consequential impacts on revenues, cash flows, and value. And, when non-biotech startups encounter difficulties, they almost routinely adjust their business models in order to survive. Just cast your memories back to when Netflix was a DVD mail-order company before it was a streaming service, or when Instagram was a check-in app with gaming and photo elements before it transformed into today’s dominant photo app.
Consequently, we need to reflect this different risk profile in our valuation analysis, such as when creating a discounted cash flow (DCF) and choosing the appropriate discount rate. Broadly speaking, there are two ways we can go about this:
- First, we could assume a positive outcome (i.e., drug works, gets approved, and revenues come through), but reflect the risk via using a high discount rate (the earlier the stage, the higher the discount rate due to higher risk). This is essentially the “venture capital method,” which is also used with non-biotech startups.
- Alternatively, we could reflect the unpredictability of outcomes explicitly by building a number of outcome scenarios and probability-weighting them. These scenarios could include “fail during phase I,” “fail during phase II,” and so on. Since in drug development we have a structured process with fairly defined scenarios, this method allows us to take risk into account much more precisely than the VC method, which effectively subsumes all risk into its high discount rate. This method, the risk-adjusted NPV, is therefore what the rest of this article will focus on.
Recommended Biotech Valuation Methodology: Risk-adjusted NPV
The risk-adjusted NPV includes two major components: projected cash flows and the probabilities for the scenarios. We will first approach projecting the cash flows for the scenarios first, then the probabilities for the various scenarios.
Cash Flow Projections
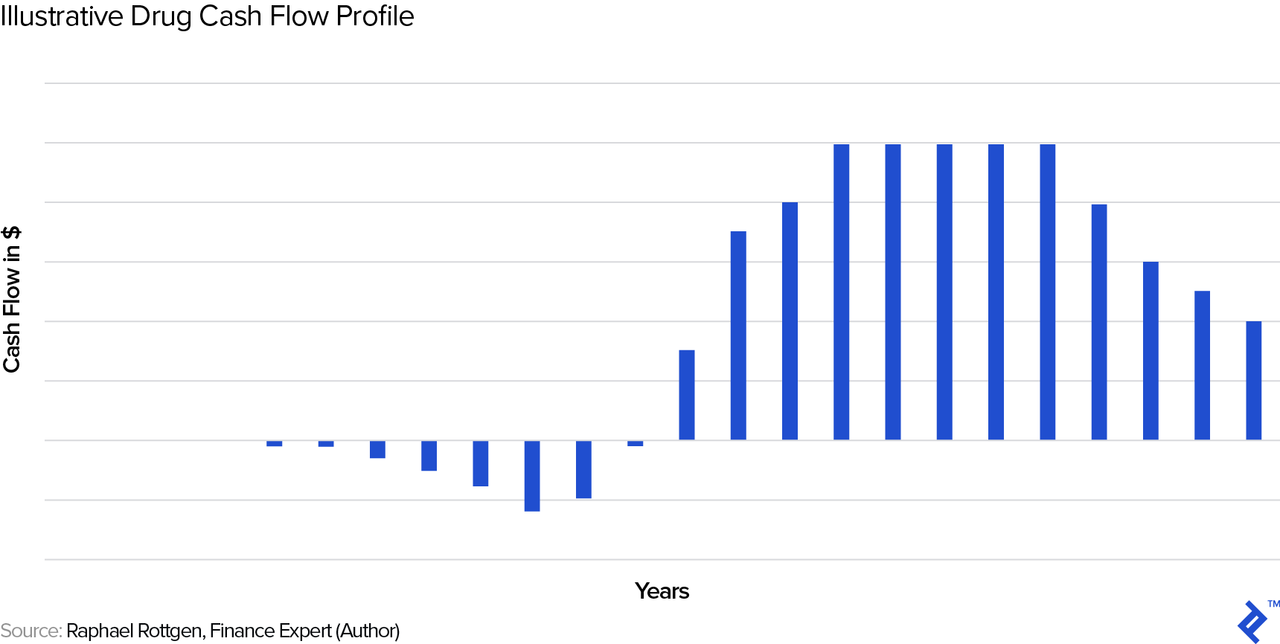
As we noted previously, drugs are unique enough that we have to build up these cash flow projections from scratch. Let us first look at a typical, stylized cash flow profile and then go through each of the cash flow drivers.
Development Phase
In the initial years, there are only outflows, due to the R&D expenses on the drug. These costs will differ for each drug, depending on factors such as the number of iterations during the discovery and pre-clinical phases, the experimental design(s) required during pre-clinical and clinical trials, and more. It basically comprises the years showing outflows in the chart above.
Revenue/Market Phase
When the drug has reached the market, here are the key drivers we need to estimate in order to derive revenue (and profit) projections. Note that we could obviously develop this framework into ever more intricate sub-drivers, but will focus on the most important drivers in this overview article. In the following section, for estimating revenue, we will roughly follow the steps laid out in Arthur Cook’s book Forecasting for the Pharmaceutical Industry (we will use some of the drivers shown in the grey boxes):
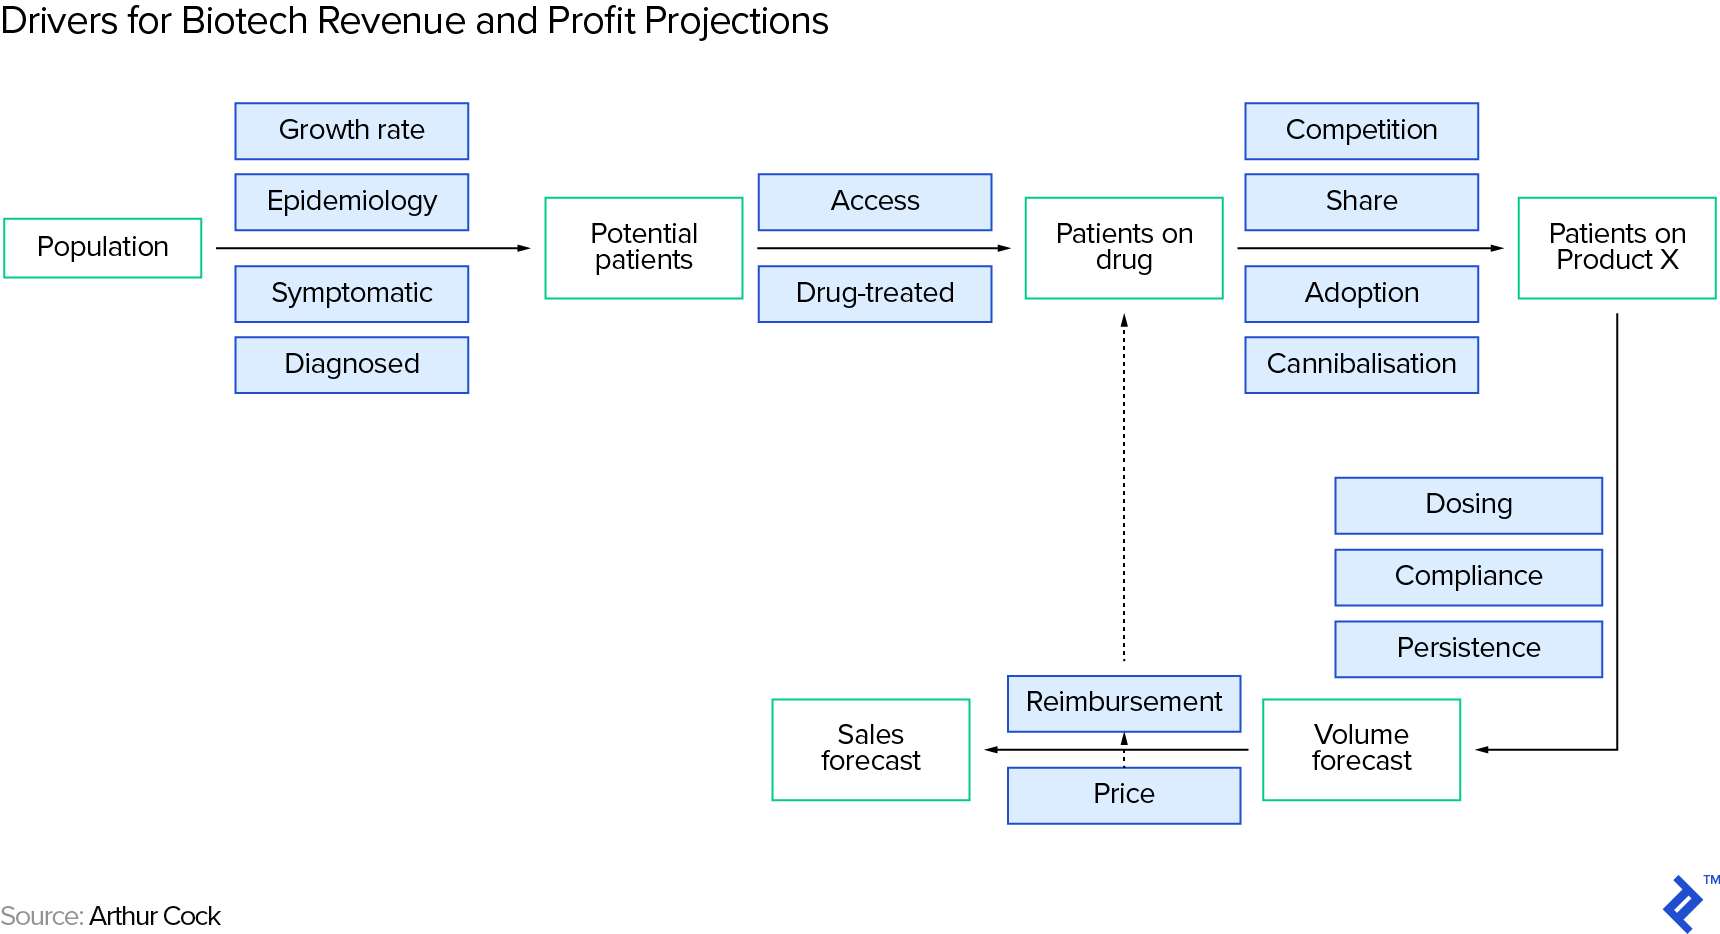
Number of Potential Customers/Patients
The number of potential customers on a drug is a subset of the people suffering from the target condition—we arrive at a rough estimate by running through a series of filters in a funnel, again roughly following Arthur Cook:
- First, you need to understand how many people suffer from the condition that the therapy intends to treat (the prevalence of the condition. Be careful to separate this from incidence, which is the rate of occurrence of new cases). You can find estimates on the internet, from sources such as the World Health Organization (WHO) or the US Centers for Disease Control and Prevention (CDC).
- Second, you need to make an assumption of how many patients will actually take a drug for their condition. This requires patients to be diagnosed with the condition (and to be diagnosed, typically the patient has to be symptomatic), to accept treatment, and to be within reach of the drug.
- Third, you need to limit the patient universe to those based in regions where the drug actually has regulatory approval (the key regulatory agencies including the US’ FDA, the European Union’s EMA and Japan’s PMDA).
- Fourth, you need to make an assumption for the drug’s market share, in case there are competing therapy options. As usual, an internet search (like on the CDC site) will provide you with existing treatment options (if any).
Pricing
Pricing is critical and will depend, amongst other things, on the pharma company’s need to make an adequate return on its R&D investment in the therapy as well as on the therapy’s value vs. competing treatment options (if any).
Even for existing drugs, reliable pricing information is notoriously hard to come by, but you can find some information on websites like Drugbank or from a number of paid data providers. Keep in mind that there is typically a significant difference between the list price of a drug and the average actual price paid (post average discounts—e.g., estimated to be 45% by a member of this conference panel) as a result of the (largely non-public) negotiations between the stakeholders including pharma companies, PBMs, insurers, and CMS. Trying to find out the actual average price paid is somewhat similar to walking onto an airplane and trying to find out what the average passenger paid for his fare—and knowing the official, full-fare price does not really help you a lot!
It would be remiss of me not to mention the macro angle on drug pricing as a potential factor, specifically the seemingly permanent political debate on drug pricing in the US—clearly, investors and biotech executives need to keep an eye on developments here.
From Revenue to Profit
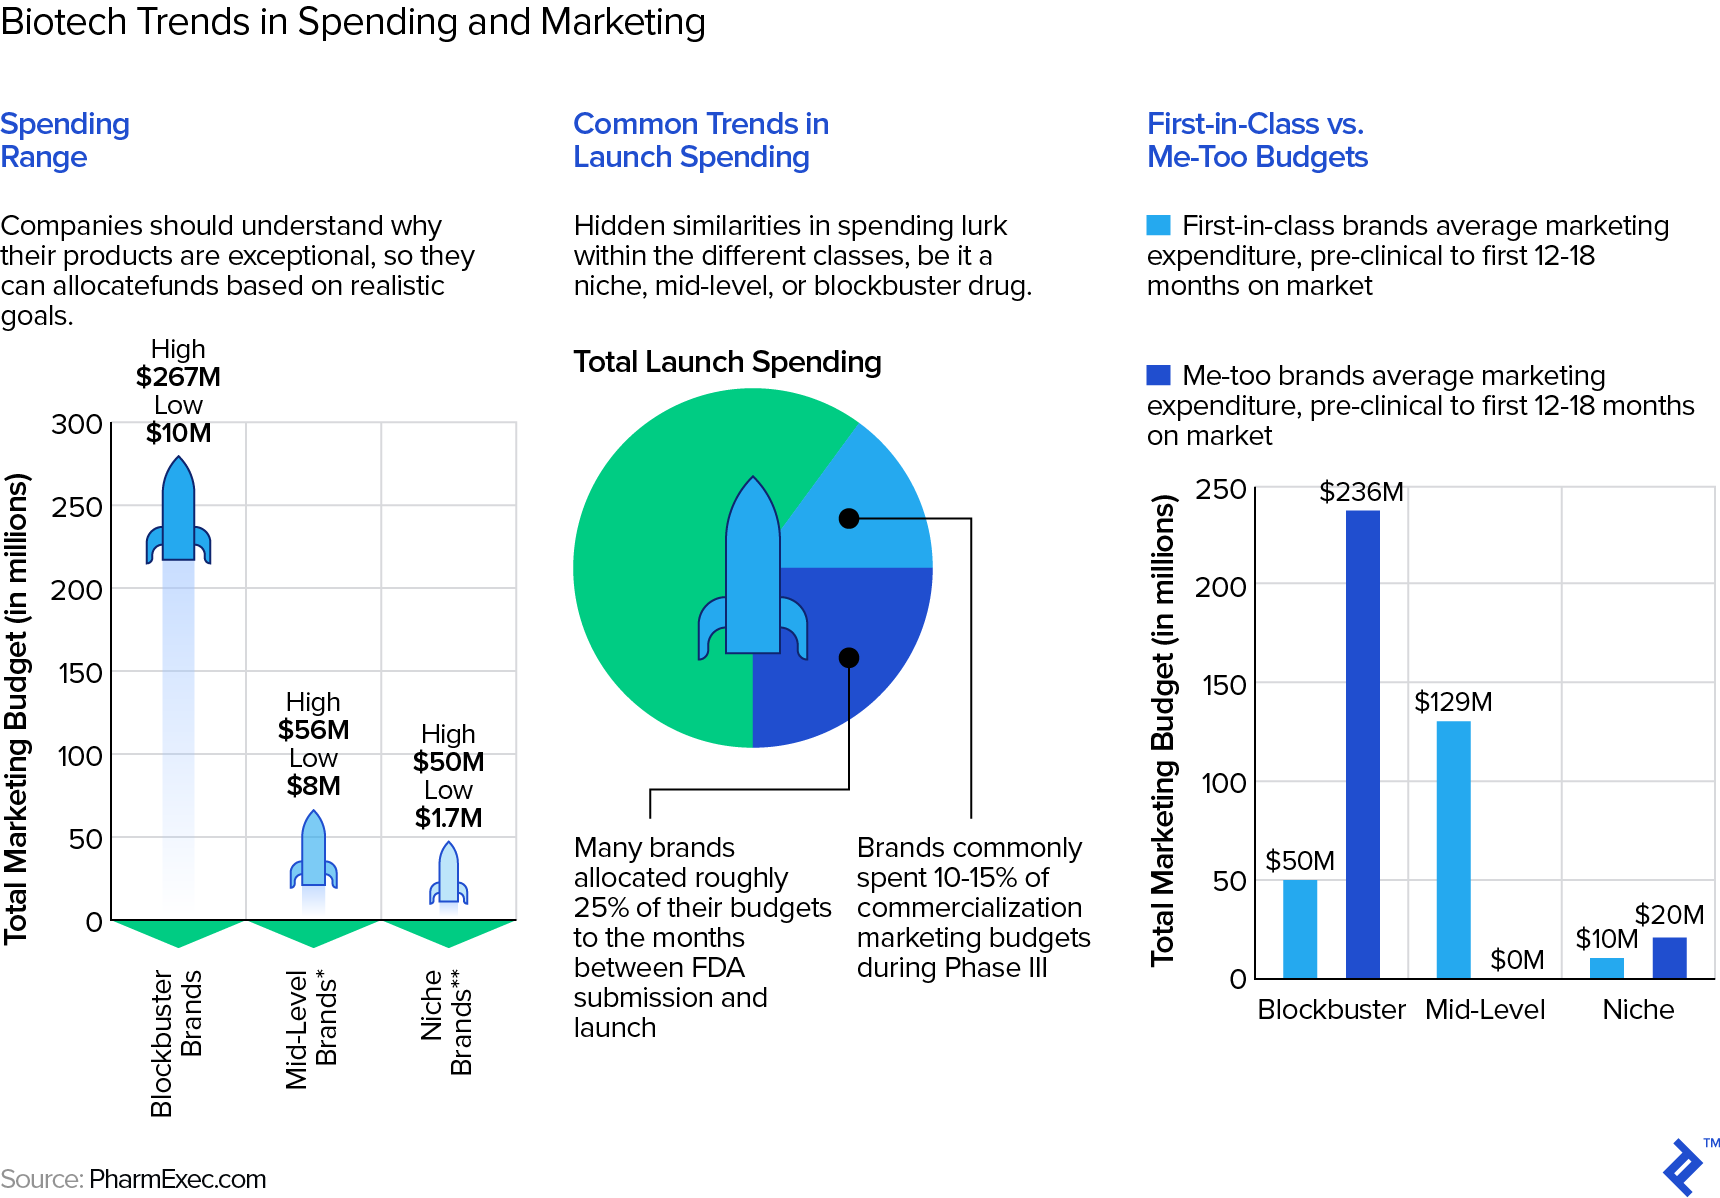
Gross margins for drugs are typically very high—a Stern School study of hundreds of pharma/biotech companies puts them in the low seventies as a mean and for entire companies. Individually, however, gross margins may be as high as 90%. The same Stern study shows average selling, general, and administrative (SG&A) expenses at approximately 26-28% of revenue but, of course, SG&A also includes the “G&A” part, including many non-sales and marketing expenses. This Statista table shows pure marketing expense for some big pharma companies to be in the low to mid-twenties as a percentage of revenue. However, these are average numbers for entire, large, diversified pharma companies. As this article points out, for any specific drug, the range of marketing expense can be wide and depend on a number of factors, such as how much competition the drug faces.
Ramping Up and Down of Revenues
The shape of the revenue/cash flow curve will often follow the stylized one above in Figure XYZ. Ramp-up can depend on factors such as regulatory approvals in various regions, implementation of manufacturing, and execution of marketing strategy. Ramp-down can be impacted, for example, by the emergence of competing branded therapy options.
Note that the stylized curve above has revenues going to zero at the end. This is due to the impact of patent expiry and the subsequent competition by generic drugs. In the US, the standard patent protection period is twenty years. However, keep in mind that new drugs typically get patented early in the process—say, during animal trials in the pre-clinical phase, when it will typically still take 8-10 years until the drug actually reaches the market, so that the actual “protected” revenue phase may be only some 10 years long. Post patent expiry, the price deterioration in the drug is typically swift and significant:

There are some potentially alleviating factors one could point out:
- In the US, the first generic manufacturer has six months’ exclusivity on generic drug sales; the branded manufacturer can also be the first generic manufacturer and hence effectively extend its protected period. There is also evidence that it pays for the branded manufacturer to be an early mover with a generic even if it is not the first one—e.g., this article mentions examples of branded manufacturers being able to claim 30-50% of the sales of the generic version of their drug.
- There are other conceivable barriers besides patents, e.g., trade secrets in of the manufacturing process or a lock-down on necessary supplies (say, e.g., viral vectors), that a company could use to protect the position of its drug. However, these are often hard to identify/foresee and hence difficult to include in the analysis.
- Branded manufacturers can also try to extend the revenues from a drug by coming up with tweaks on the original product that can be patented (e.g., using a different delivery system). See also this article for strategies of how to squeeze more revenue out of a drug despite patent expiry.
Nevertheless, cash flow projections for drugs often do not assume any cash flows (and hence terminal value) post patent expiry.
Other Impacting Factors on Cash Flow Projections
On the topic of cash flow projections, one also has to keep in mind any potential adjustments to the typical revenue/cash flow curve, of which I will mention just two prominent examples.
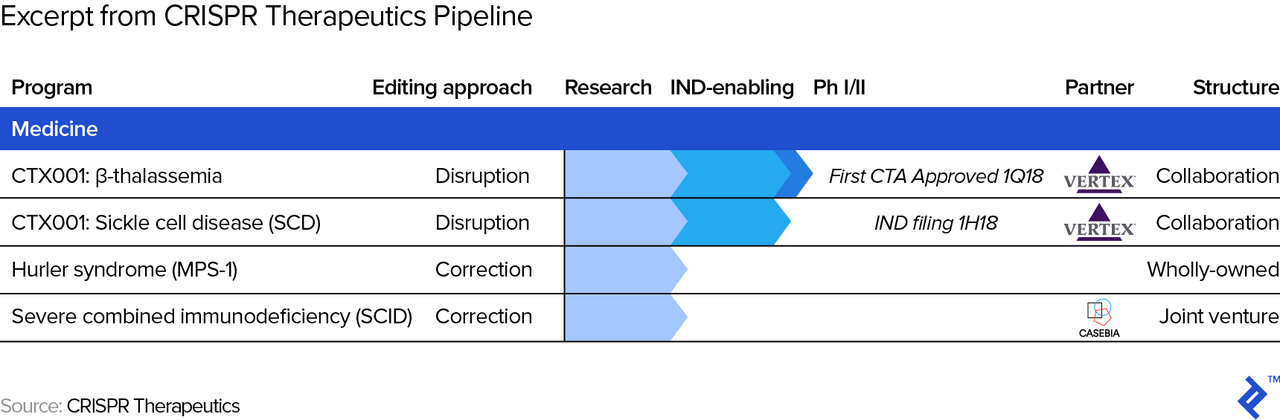
- Partnerships. The terms of partnerships (with other pharma companies) may impact cash flows at any stage. For example, a strategic partner may help out with R&D and/or marketing expenses in exchange for a revenue share, effectively flattening the cash flow profile from below and above. The picture below shows an excerpt of CRISPR Therapeutics’ pipeline, where one can see the two partnership arrangements. One is with Vertex which, among other conditions, allows Vertex Pharmaceuticals to in-license therapies from CRISPR Therapeutics (allows Vertex to sell its drugs/therapies) in exchange for payment of “future development, regulatory and sales milestones of up to $420 million per target, as well as royalty payments in the single digits to low teens on future sales of a commercialized product candidate.”
- Accelerated regulatory review. Both the FDA and EMA offer the potential of an accelerated approval process (“Fast Track”/”Breakthrough Therapy”/”Accelerated Approval”/”Priority Review” designations at the FDA and “Accelerated Assessment” designation at the EMA) for qualifying drug candidates, in which case the cash flow curve gets compressed, or shortened. For example, recently, the FDA allowed for the expedited development of Lenti-D, which treats adrenoleukodystrophy (CALD), a rare and life-threatening neurological disorder. Needless to say, we have to adjust cash flow projections whenever necessary when, say, a competing drug in development shows favorable results and we may hence have to adjust future market share assumptions.
How About Cures?
What if the therapy candidate proposes to completely cure a condition rather than treat or manage it via repeat administration (what we implicitly assume above)? Especially with the advent of the first approved gene therapies, this is now an increasingly relevant possibility. This presents some interesting consequences for our cash flow projections, as outlined below:
- The revenue curve may look different. This is because, in theory, the therapy should initially work its way through all (reachable) patients suffering from the condition, but then (assuming it can reach its entire existing patient universe during the time of patent protection) drop to new cases only (the incidence rate). How long this initial phase lasts will depend on many factors, including the condition itself. There are probably few precedents to date but, as an example, you could consider that the successful WHO program to eradicate smallpox lasted from 1966-1980. As a side point, there are sometimes conspiracy theories or at least concerns that drug companies may be disincentivized to find cures, as shown in this thread (which includes responses making the counterpoints).
- Pricing and pricing structure become even more challenging. Does the drug company charge a one-time up-front fee (and, if so, is there a “clawback” if the patient relapses) or perhaps a multi-year installment payment plan, conditional on the patient not relapsing? And, is this latter option even feasible from a legal point of view in the jurisdiction of sale? As an aside, prices for these one-time cures become very high as, of course, they are supposed to essentially reflect the NPV of the savings on what could otherwise be continued care. Drug companies may argue that the price should/could even also reflect the value of the potential positive societal externality from a cured person, since, for example, a person who is cured of blindness can probably generate a higher contribution to society (in terms of GDP) than a blind one. On this specific example, Spark Therapeutics’ cure for inherited blindness (“Luxturna”) costs $850,000 per patient/treatment.
Now that we have reviewed considerations in cash flow projections, let us move on to the probabilities which we will use to weigh these cash flows.
Probability of Scenarios
So, what probability of success should one assume for a drug candidate? As a general principle, we should be “good Bayesians,” starting with a sensible base rate of success and then continuously adjusting for new evidence.
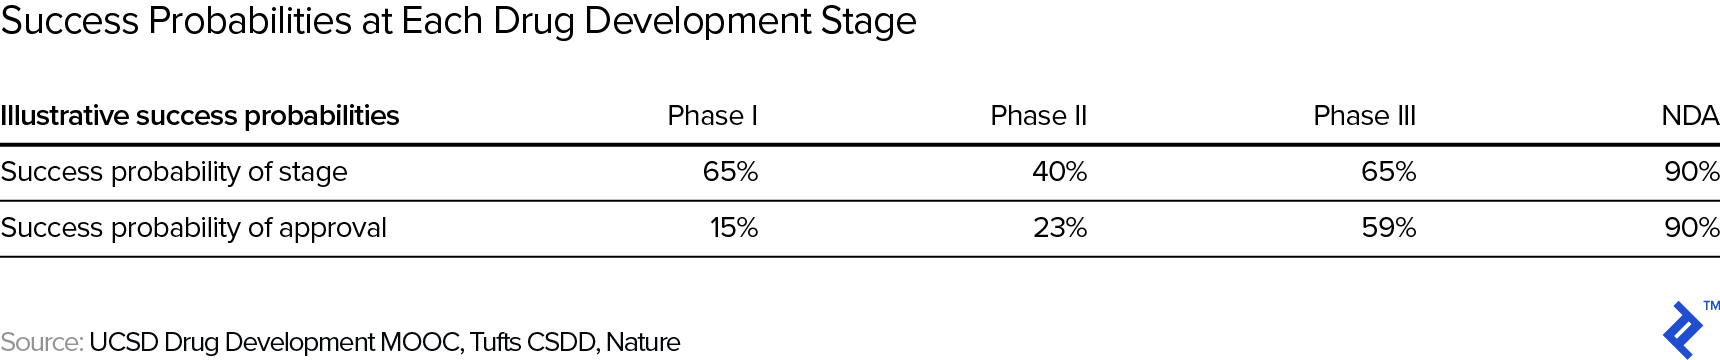
The table below, an amalgamation of various studies on the topic, shows the approximate success probabilities of each stage, starting from clinical, in the drug development process (upper row) as well as the cumulative probability of getting the drug approved (lower row—so, for example, the probability of passing phase I is approximately 65%, but the overall probability of making it from the start of phase I to an approved drug is 90% × 65% × 40 × 65% = 15%, as shown in the lower row). Note that NDA stands for new drug application and the percentages refer to the NDA being successful.
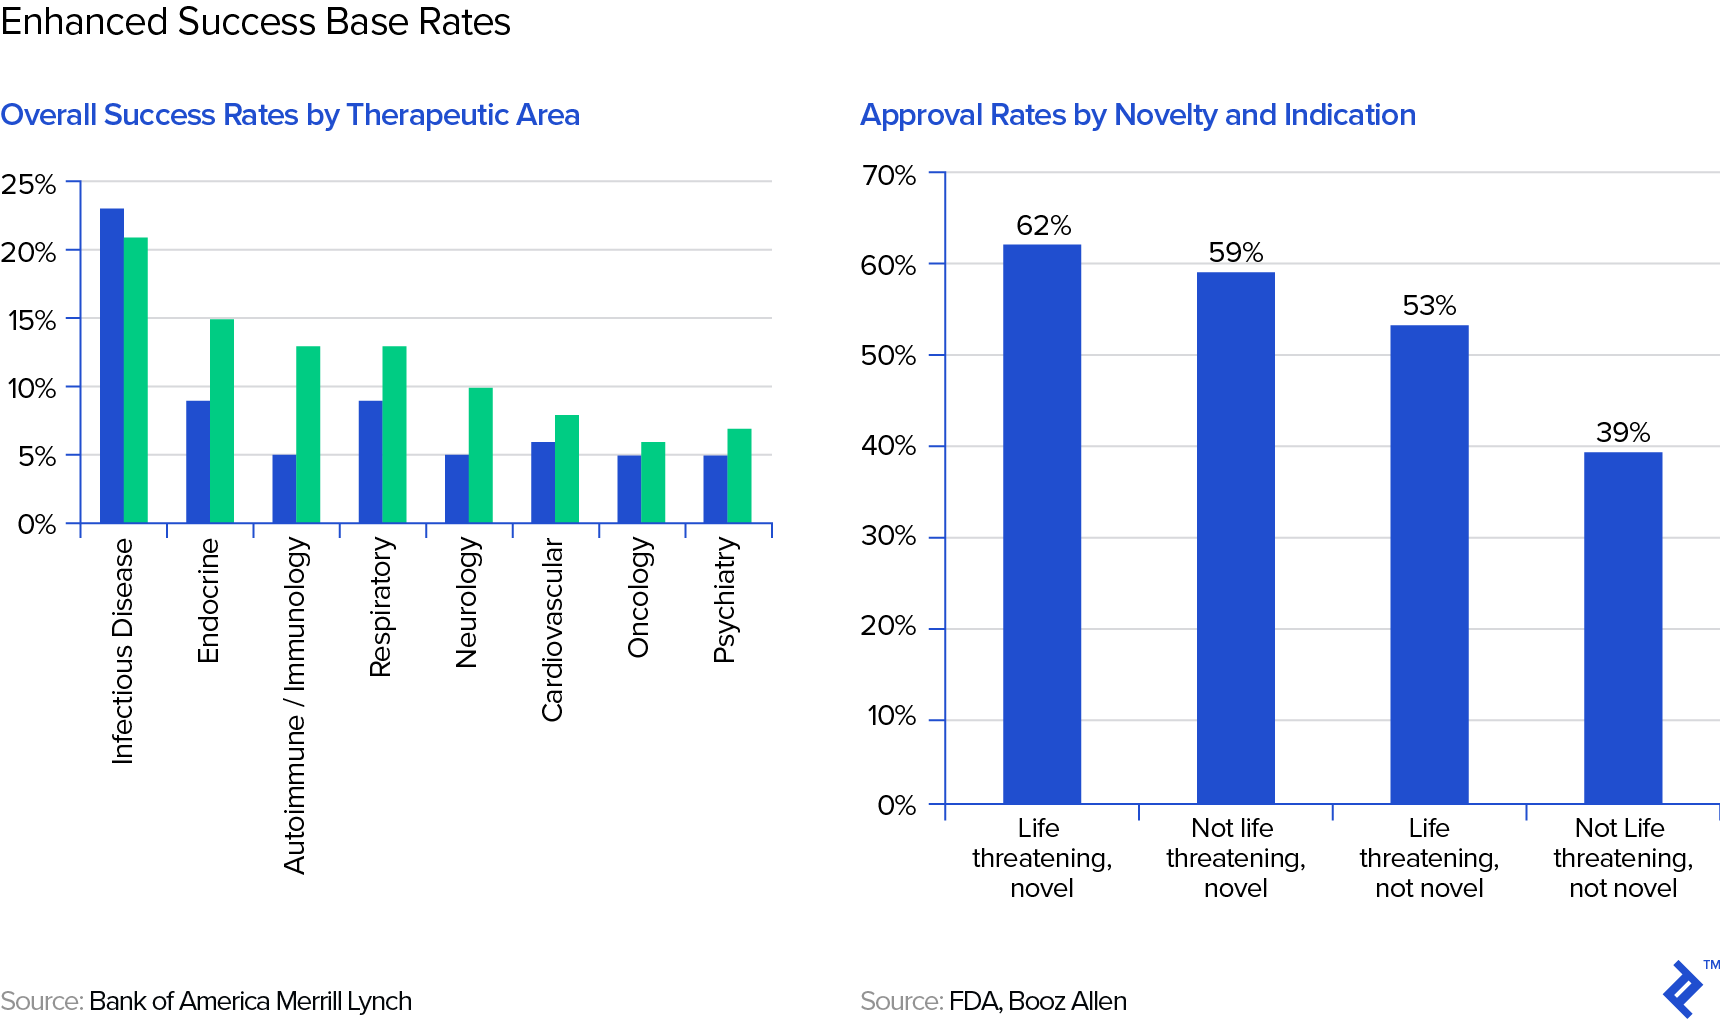
These, of course, are the most general base rates we could use and we should and can be enhanced by taking into account the therapeutic area or novelty of the drug candidate, as shown in the following graphs from Bank of America Merrill Lynch:
There are further potential adjustments to the base rate one could come up with, even such that do not have anything to do with the drug itself, such as the track record of the company (its R&D and regulatory teams) in getting drugs approved.
One then needs to make adjustments to the base rate whenever relevant evidence becomes available. The most obvious example is passing a clinical trial stage and tables like the one above already provide the new, adjusted probability (but, fortunately for us, the Bayes calculation matches the table number, e.g., for passing phase I: 15% × 100% / 65% = 23%). There are much less trivial adjustments; for instance, imagine a drug of a competitor, targeting perhaps the same pathway, runs into problems in a clinical trial.
Developing the Scenario Tree
Though base rates are helpful, assuming only two scenarios (success/fail) is often too simplistic. If we have a drug candidate entering phase I, we face at least the scenarios depicted in the scenario tree below—there are obviously many other outcomes that are not captured in this tree. Note that the US dollar amounts are in millions and represent, at each node, the expected NPV. You will note that the success probabilities here do not match the ones in our summary table above, illustrating that there are a variety of estimates.
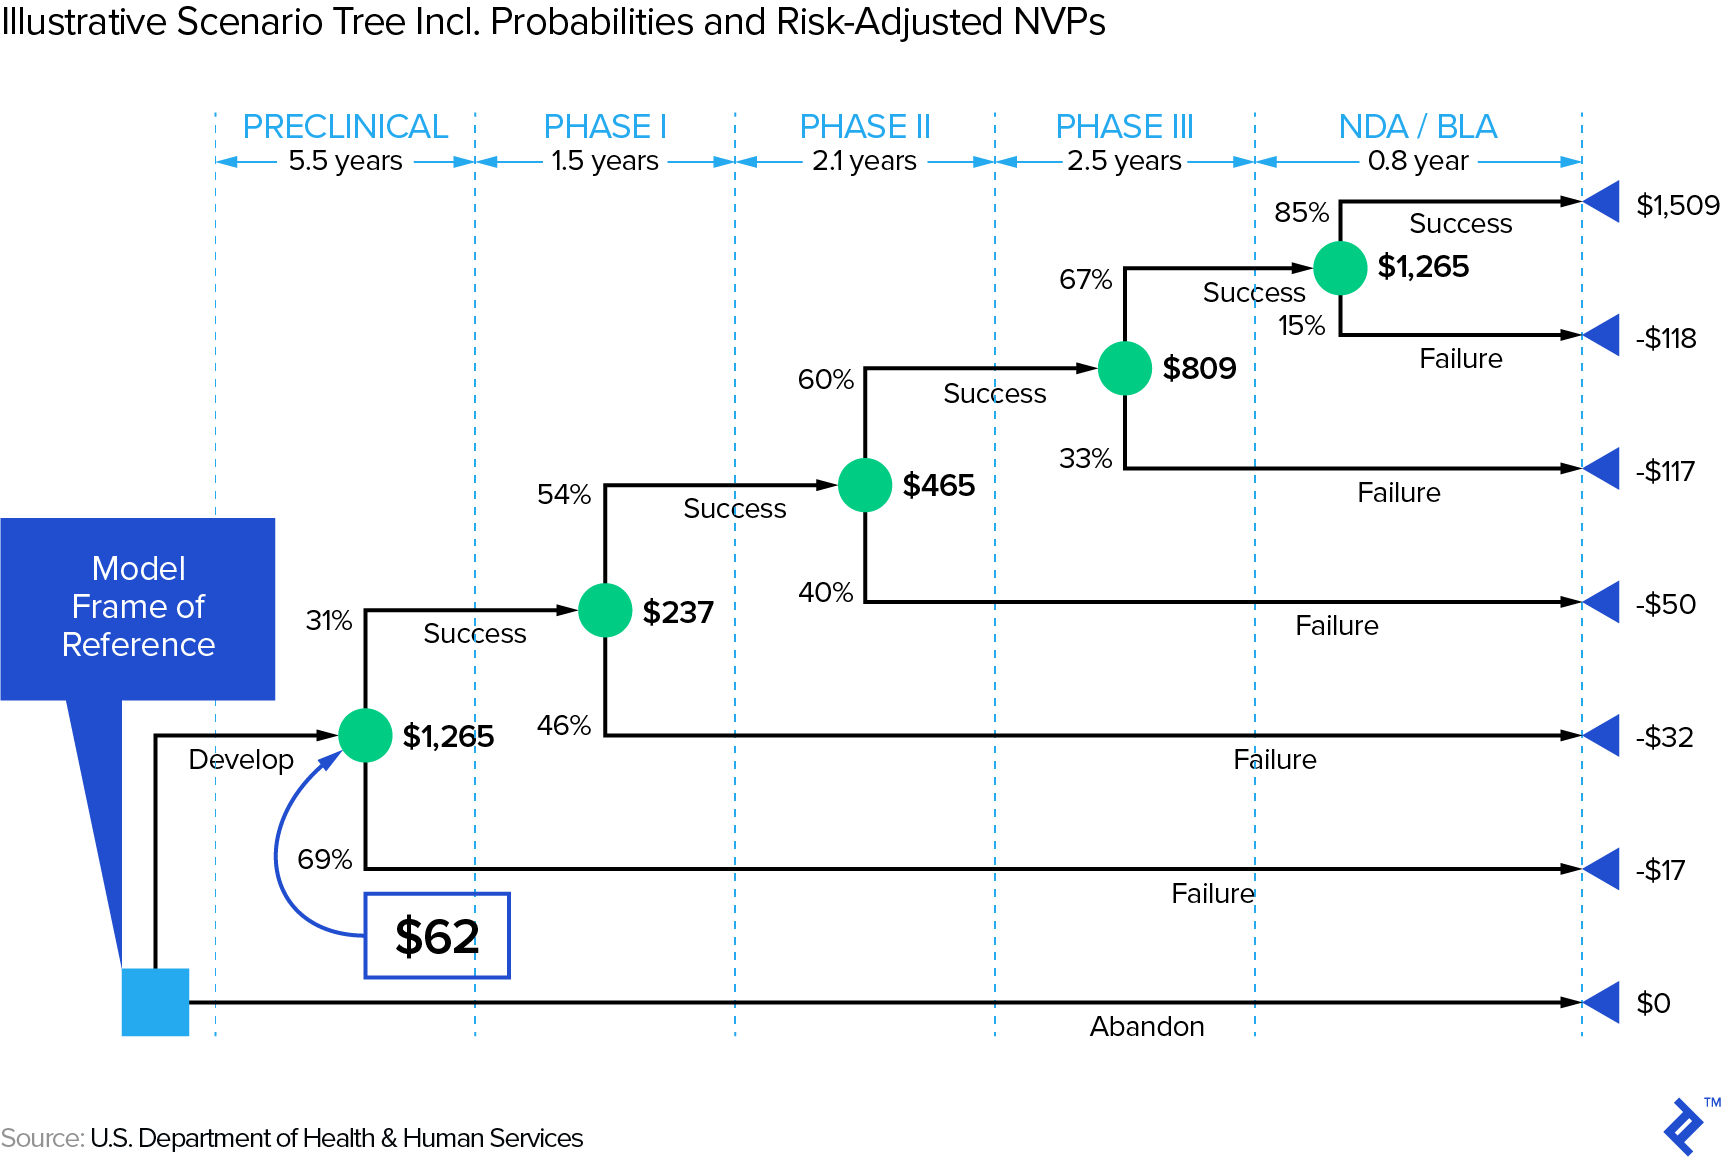
First, note that it obviously matters when a drug fails—the later, the more money will have been spent on R&D. In other words, it (literally) pays to embrace that Silicon Valley mantra: “fail fast, fail often.” This is relevant in the context of a sector that has experienced decreasing ROIs on R&D expenditure (e.g., from 10.1% in 2010 to 3.7% in 2016 in a Deloitte study of twelve leading biopharma companies). How one effectively fails fast and often would be an article by itself—check out this Toptal article on how big data can address this issue.
Second, this scenario tree stops post NDA approval, but one could conceivably develop scenarios for the post-approval—i.e., revenue—stage, too. However, the outcome distribution in that phase will hopefully be more continuous so that one can often simplistically work with one scenario using expected values.
Discounting Back to the Risk-adjusted NPV
Once we have developed the scenarios and their respective cash flows and probabilities, we need to discount the cash flows back to the present. On the one hand, we have to be mindful that we have already captured some uncertainty/risk via the scenarios, so we should not use an excessively high (venture capital method style) discount rate. On the other hand, the earlier stage we are at, the more residual risk (not captured via scenarios) there is, justifying a higher discount rate. Here are some example discount rates for biotech companies at different stages of maturity:

It is important to correctly interpret this risk-adjusted NPV: It’s an expected value, masking an underlying outcome distribution that can be as simple as being close to binary (e.g., a company with one phase III drug in the pipeline) or much more complex in the case of a company with multiple drugs in its development pipeline—which brings us to our next topic: how to manage multiple drug candidates.
Multiple Drug Candidates: The Portfolio View
Let’s use an example to understand how a one-drug pipeline may differ from one with several drugs. On the way to the biotech investment conference, a street hustler grabs you and offers you a coin flip game: heads you win $100; tails you get nothing—how much would you pay to play? Then, another street hustler comes along and offers you a slightly different game: He will flip the coin ten times and you win $10 every time heads come up—how much would you pay to play in this case? Let’s examine the potential outcome distributions—mathematically speaking, a Bernoulli distribution on the left and a binomial distribution on the right:
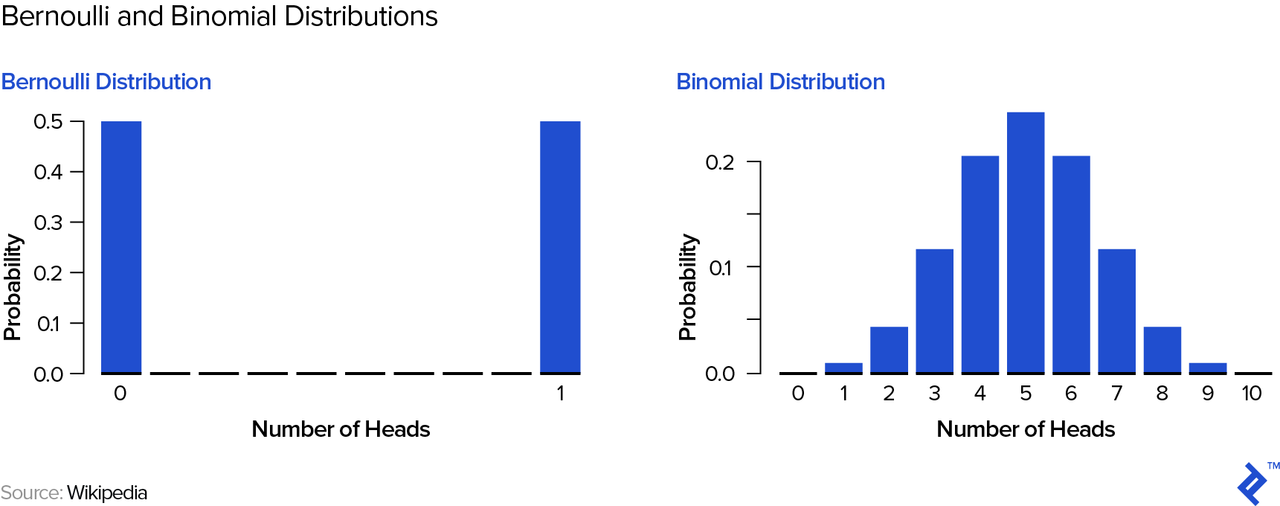
Your expected winnings are actually $50 in either game; however, you can easily see and intuitively understand that the 1-coin flip game is “riskier.” In order to quantify this risk, we can look at the standard deviation of your winnings—$50 for the 1-coin flip game and approximately $16 for the 10 coin-flip game. Therefore, if you were forced to play and pay the “fair” price of $50, most people would pick the second game—its risk-adjusted return is superior to the first game’s, a point to which we will return below.
Of course, by now you have understood that we can substitute “coin flip” with (e.g.) “phase III drug” and set the probability to the appropriate one, in that case, say 65% as per the table above (ignoring the subsequent NDA stage)—a coin that is biased in our favor! The one coin flip case would be a company with only one such phase III drug in its pipeline, whereas the ten coin flip case may be one company with ten phase III drugs, or (from, e.g., a biotech investor’s point of view) several companies with a total of ten phase III drugs in their pipelines (each single company may have as few as just one pipeline drug).
Even if we just stick to a simple fail/success binary outcome, you can see that the number of potential outcomes scales exponentially with the number of drugs (n), specifically: 2n. Once we add in all necessary intermediate scenarios, as per the discussion above, things can get unwieldy quickly and too cumbersome to calculate by hand or on a spreadsheet. My choice would be to run a Monte Carlo simulation in an appropriate computing environment—not Excel!—e.g., R. The simulation essentially “flips coins” (respecting the input probabilities the user provides) at every outcome node and runs a large number of trials, eventually covering/providing a meaningful sample of outcomes that could happen in the real world. The Monte Carlo simulation hence outputs a distribution of outcomes (specifically, NPVs) on which you can then calculate statistics like the mean and standard deviation.
One caveat: The probabilities of success for several drugs may not be statistically independent of each other—e.g., imagine a company that has two (or even more) drugs that use the same innovative therapeutic approach, focusing on different conditions. In that case, the math becomes more complex and goes beyond the scope of this overview article.
So, in the line of comparing the coin flip games at the beginning of this section, how can one compare (in a quantified way) pipelines with several drugs against each other? This also goes beyond the scope of this article, but suffice to say we can borrow metrics from finance that are designed to adjust returns for risk—e.g., the Shape ratio or Sortino ratio. In general, though, one takeaway from this section should be that multiple drugs (especially if independent of each other) de-risk the drug portfolio, which is also the reason why a one-drug, pre-clinical biotech startup may have to offer 100%+ expected IRRs to its venture investor, whereas that same venture fund, benefiting from diversification, may get away with offering 20-30% IRRs to its investors.
Does this mean every biotech company should try to have several candidate drugs? Not necessarily. This is a complex question that depends, inter alia, on things like the company’s scientific, management, and financial capacity. If you have the world’s best team to work on a specific therapeutic approach, you can intuitively see that forcing that team to diversify into other areas may be distracting and therefore possibly even increase risk. If a biotech company wants to de-risk, there are, of course, also other ways—notably, via partnerships whereby, e.g., the company gives up some upside (revenue share) in exchange for limiting downside (sharing R&D and/or eventual marketing cost). In such a partnership, a biotech company’s drug may also help to de-risk the other company’s overall pipeline, which brings us to final discussion.
What Is the Pipeline Worth to Somebody Else?
There is standalone value (the subject of this article up to this point) and then there is the value of a company to somebody else (like a partner, investor, or acquirer), which takes into account factors such as:
- Operational synergies—e.g., on R&D, manufacturing, or marketing
- “Strategic” synergies
- Financial synergies—e.g., the other company may have a lower hurdle rate due to lower cost of capital. (think a big, diversified pharma company)
- The de-risking impact we discussed in the previous section—i.e., improving the acquiring company’s risk-adjusted expected returns
Parting Thoughts
As a finance professional and enthusiastic hobby biologist who loves to read biology books and take open online medicine courses, I am inclined to close on the following note: I hope that while the scientific work is the most important value driver of a biotech company, there is room for savvy financial experts to add value, such as tasks like conceiving and negotiating partnerships that increase risk-adjusted returns and hence value to all sides. As prominent biotech investor Stephen Diggle noted in a recent Bloomberg article: “Bringing financial expertise to fledgling biotech companies helps create value because management consists mostly of scientists who focus on research and development.” Of course, if the financial expert has some domain expertise and is passionate about the science, all the better!
Understanding the basics
How much does it cost to develop a new drug?
Drug development is notoriously expensive. Studies show that the total cost of developing a successful drug is between $1.4 billion and $2.5 billion.
What is the process of drug development?
A typical timeframe for a new drug from submission of the Investigational New Drug (IND in the US) to market entry, post regulatory approval, is around eight years. During those eight years, the process follows structured phases of research, testing, and FDA review, during any of which the drug can fail.
Raphael Rottgen, CFA FRM
Zürich, Switzerland
Member since August 25, 2017
About the author
Raphael is a partner at a crypto hedge fund. Prior, he founded and exited a fintech company, and worked as a banker and equities investor.
Expertise
PREVIOUSLY AT